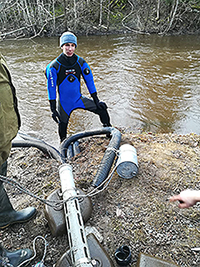
A Russian partner in Rakkolanjoki River doing equipment maintenance.
Eagerly we started continuous water quality measurements in Finland in 2009. Our expectations were high of the new measurement method and its opportunities. We could get more measurements per day than previously throughout the whole year!
We expected that the best benefit is obtained in situations where there are large and rapid water quality variations. Traditional water sampling is not able to catch these extreme situations. There are many examples of the use of continuously measured water quality data. It will improve the nutrient load estimates. It can be used to evaluate the effectiveness of water protection measures.
On the research side, another important application is the development and testing of nutrient loading models. Measurements can also be used to test remote sensing data. In addition, the measurements can be used to highlight the quality of nearby waters to the average citizen.
How to get reliable measurements?
Continuous water quality measurements require manual water sampling so that the data can be set to the right level. This is called site-specific calibration. The number of samples required is not unambiguous. The general characteristics of good calibration data are:
- observations of as diverse hydrological conditions as possible and throughout the seasons of the measurement period; and
- the number of samples is sufficiently high, especially at high and low flow conditions.
A good high-quality automatic monitoring includes a functioning chain of site selection, validation, installation, maintenance, calibration, reliable laboratory analyzes and professional quality assurance of measurement data.
Measurements started in Russia
Rakkolanjoki River (Селезнёвка, Seleznjovka) is a transboundary river flowing into the Gulf of Finland. In Finland this river flows through the Lappeenranta city area and in Russia in the Vyborg district. There are 370 km² of the river basin on the Finnish side and 252 km² on the Russian side. On the Russian side, the Rakkolanjoki River joins the Hounijoki River in Nurmi. The river flows into the Vyborg Bay on the west side of Vyborg near the village of Tienhaara (Seleznovo).
As part of the SEVIRA-project, we started continuous water quality measurements on the Russian side in late autumn 2019. First we chose a suitable place together with the Russian partner. One of the main selection criteria was a safe measurement site that an occasional passer-by could not reach. Such a place was found in the back yard of a private person whose house was on the bank of the Rakkolanjoki river.
Another challenge arose from how we get all the measuring equipment imported from Finland to Russia. As the customs formalities were quite bureaucratic, we ended up using a private transportation company. This proved to be a good choice and the measurements could be started.
River flows vary from place to place
The winter 2019–2020 was not only the warmest in the history of measurements in Finland, but also exceptionally rainy in Southern Finland. River discharges rose to flood levels several times in December – February. However, the situation was totally different in South-Eastern Finland. The discharges were only of normal magnitude. Despite this, at the ice breaking time, some of the sensors loosened from the mounting stands. Therefore, we got both gaps in the measurement series and obviously a need to fix the installation (see Fig.1 – turbidity). This was not an easy job to do. Due to the Covid-19 pandemic we could not travel from Finland to maintain the equipment, but luckily the maintenance was done by the Russian partner. Thus, the measurements continued despite a small setback.
What measurements tell us about water quality
Based on the old measurement observations of the Rakkolanjoki River, we knew that the water quality is poorer on the Finnish side. This is mainly due to the city of Lappeenranta and the larger share of agriculture in the area. On the Russian side, there is little agriculture and there are mainly small villages in the area.
Fig. 1. Turbidity variation at the Lugaika on-line station. Green line shows the water temperature variation. The dashed blue line represents the missing observations caused by ice breakup in early March. Click to open a bigger picture.
The base line turbidity was generally quite low, between 10–20 NTU. Turbidity peaks largely reflect flow peaks. The maximum for the spring season was over 60 NTU assuming we did not lose the highest peak at the time of the ice breakup (see Fig. 1). Nitrate nitrogen variation is shown in Fig. 2. Variation may be due to both Lappeenranta's WWTP emissions and agricultural activities, as well as fluctuations in flow. Nitrate nitrogen varied between 0,6 and 2.2 mg / l during Dec 2019 - May 2020. Laboratory measurements coincide quite well with continuous measurement, except for a few points (9.1. and 10.3.2020, see Fig. 2).
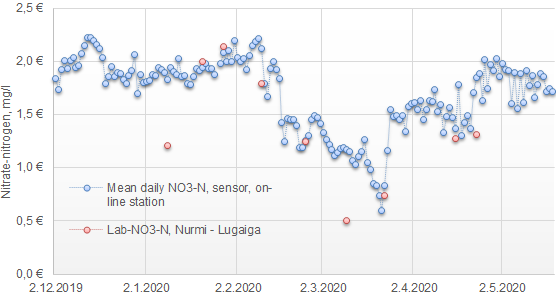
Fig. 2. Daily nitrate nitrogen variation during December 2019 – May 2020.
Measurements of chlorophyll-A were also started in the Rakkolanjoki River (Fig. 3). Chlorophyll is not usually measured in rivers. Looks like that the amount of chlorophyll increases as the water temperature increases. It will be interesting to see how the amount of chlorophyll increases during the summer. In any case, it is important to find out from measurements in other rivers about the general variability of chlorophyll in the river environment so that we can assess the reliability of the chlorofyll-A measurement in the Rakkolanjoki River.
Fig. 3. Chlorophyll A and water temperature variation at the on-line station. Click to open a bigger picture.
To end up with
After small initial difficulties the device maintenance works well by the Russian partner. When the corona restrictions end, we will evaluate the operation of the equipment with the supplier and at the same time reinstall the sensor support stands.
When the measurement series is replenished, we surely get a better picture of the variations of the measured variables. Later measurements can also be utilized in model calibration or testing.
Sirkka Tattari works as hydrologist in Finnish Environment Institute.