The overall goal of the modeling task is to use the calibrated models for simulating land-use changes, testing of the effectiveness of water protection methods and climate change scenarios.
In the framework of the SEVIRA project, it would also be important to validate the accuracy of the land cover data in the Russian side. Present land cover information covering the drainage basin of Rakkolanjoki are produced using multitemporal Sentinel 2 data together with ancillary map data. Interpretation of satellite data was completed using decision tree classifier, which was trained using recent high resolution land cover data in Finland. The output was combined in Russian territory in selected land cover categories (croplands and grasslands) with corresponding information produced in Russia.
The SWAT-model
One of the pilot areas in the SEVIRA project is the transboundary Rakkolanjoki River in the Finnish-Russian border zone. In the project, the SWAT model is applied to this catchment area. SWAT is a physically-based, continuous-time model that simulates the movement of water, sediment, nitrogen and phosphorus compounds within a catchment with a daily time step. SWAT requires specific information on weather, soil, topography (DEM), vegetation and land management and computes the processes associated with water and sediment movement, plant growth, nutrient cycling etc. using this input data. One of the tasks in the project is to combine the available GIS based DEM, land use and soil data from Finland and Russia and form a unified GIS file of these different resolution map based data, which then can be used as input for SWAT-modelling.
In Russia, there have been some technical difficulties in implementing the QSWATmodel. Most of the input data has been read in the Virojoki QSWAT model application, but there have been challenges in reading climate data, among others. We're currently trying to find out where the problem is.
Rakkolanjoki map based data
On the Finnish side, all necessary GIS data is already available and therefore the model is first tested in the Virojoki river basin, which is entirely on the Finnish side. Model testing is important because model deployment takes time and it's much easier then “repeating” modeling for the Rakkolanjoki catchment once everything is done once. At the river Rakkolanjoki, the elevation model (DEM) and the land use map are ready to use in modeling. As seen from the figures1-3, the accuracy of the map material is weaker on the Russian side, because the resolution of the data was less reliable than in the Finnish data. Work on soil map data is still ongoing. On the Finnish side, the material would be ready, but only a soil map in paper format has been received from Russia. Soil classification differs from country to country and therefore it is also necessary to estimate which categories (in Finland: Rocky soil, moraines, coarse soils (sand etc.), fine-grained soils (clay etc.), and peat soils) correspond to soils in Russian classification. Modeling on the Rakkolanjoki River cannot be started until the soil data from Russia is ready and unified with Finnish data.
Acquisition of new data
From April 2019 IL RAS has made monthly water quality monitoring of nitrogen and phosphorus concentration in the small catchments of the river Sestra and Russian part of the river Rakkolanjoki. These observations provide information on nutrient loading from different land uses types, which is needed as input data for the loading model (ILLM), which is applied for all three catchments. Runoff from the catchment of the river Sestra for the period 2000 – 2014 was simulated using the Hydrological model ILHM. Runoff calculation for the Rakkolanjoki and the Virojoki catchments was made using the SYKE data as input for modelling. IL RAS continues to collect information about nutrient loading and agricultural practices for the Sestra catchment and Russian part of Rakkolanjoki catchment.
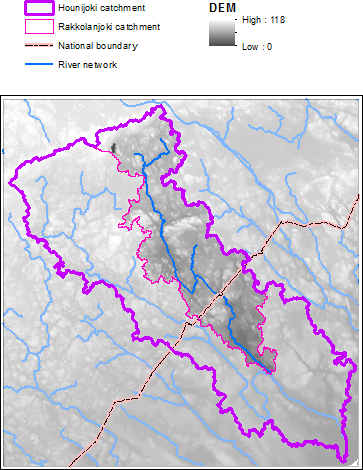
Figure 1. Digital elevation model (DEM).
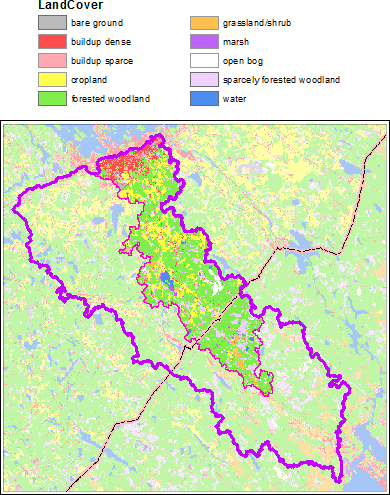
Figure 2. Land cover data:
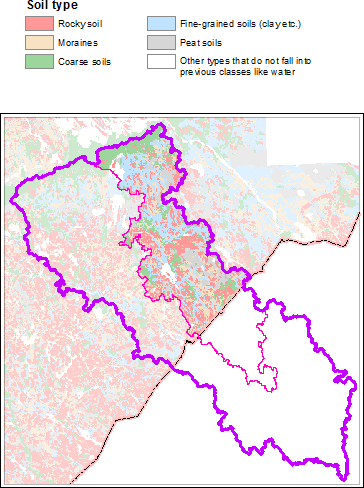
Figure 3. Soil data.